Custom dashboards in Analyse allow you to visualise the most relevant data for your needs, making it easier to track trends, customer sentiment, and brand performance. You can add, edit, and customise dashboards to focus on specific insights.
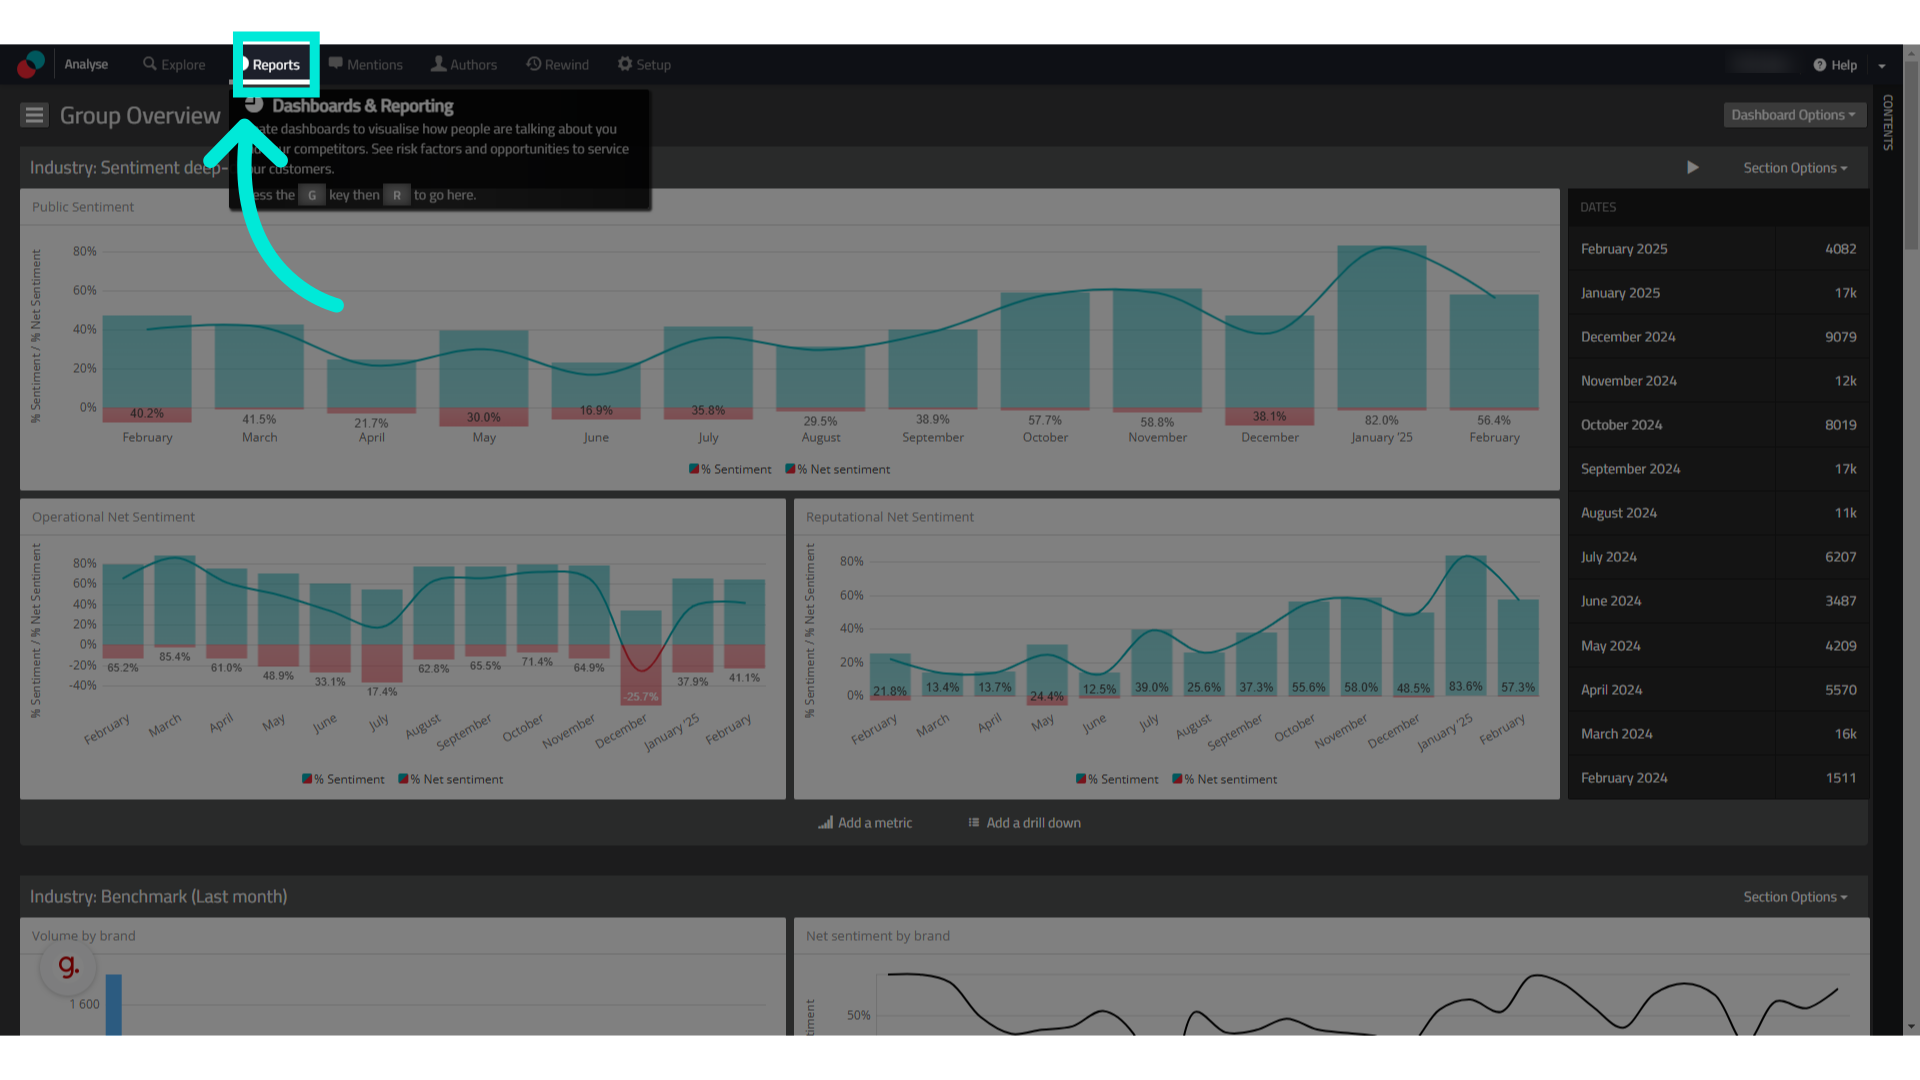
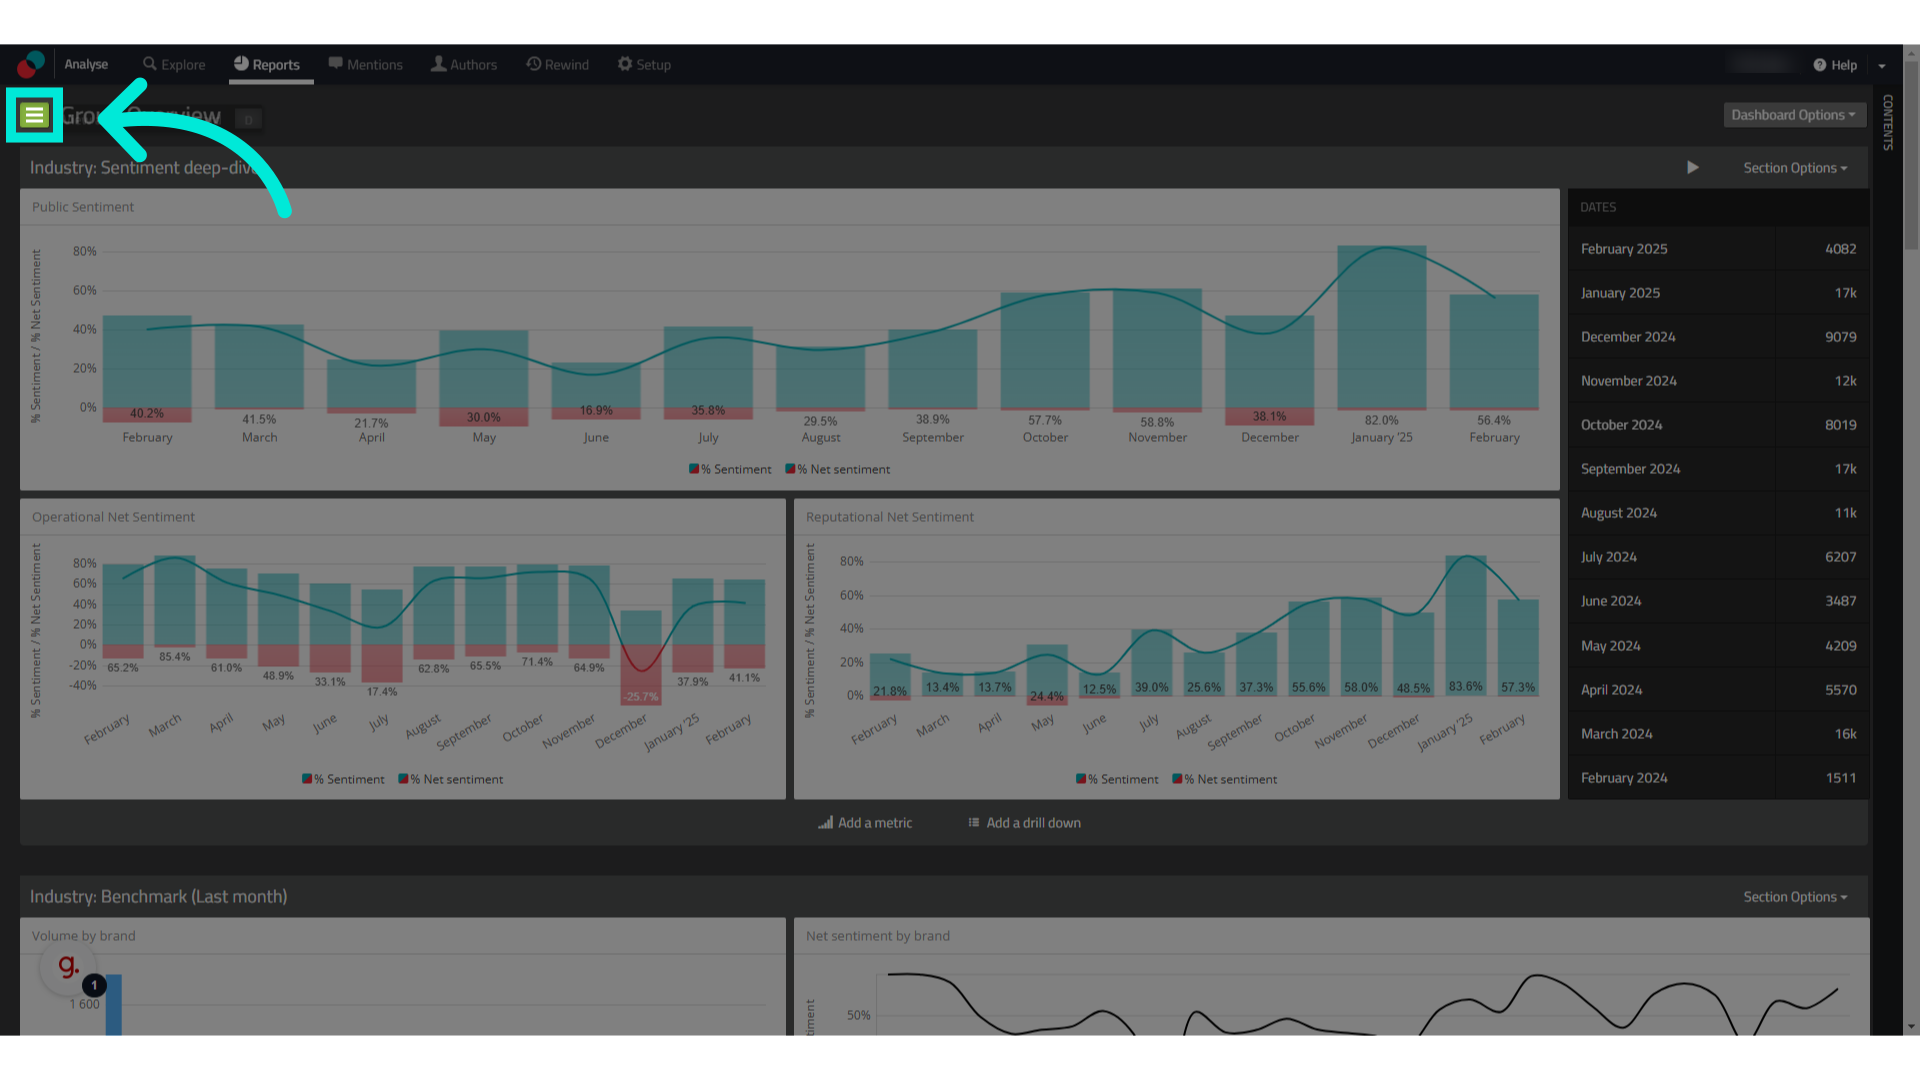
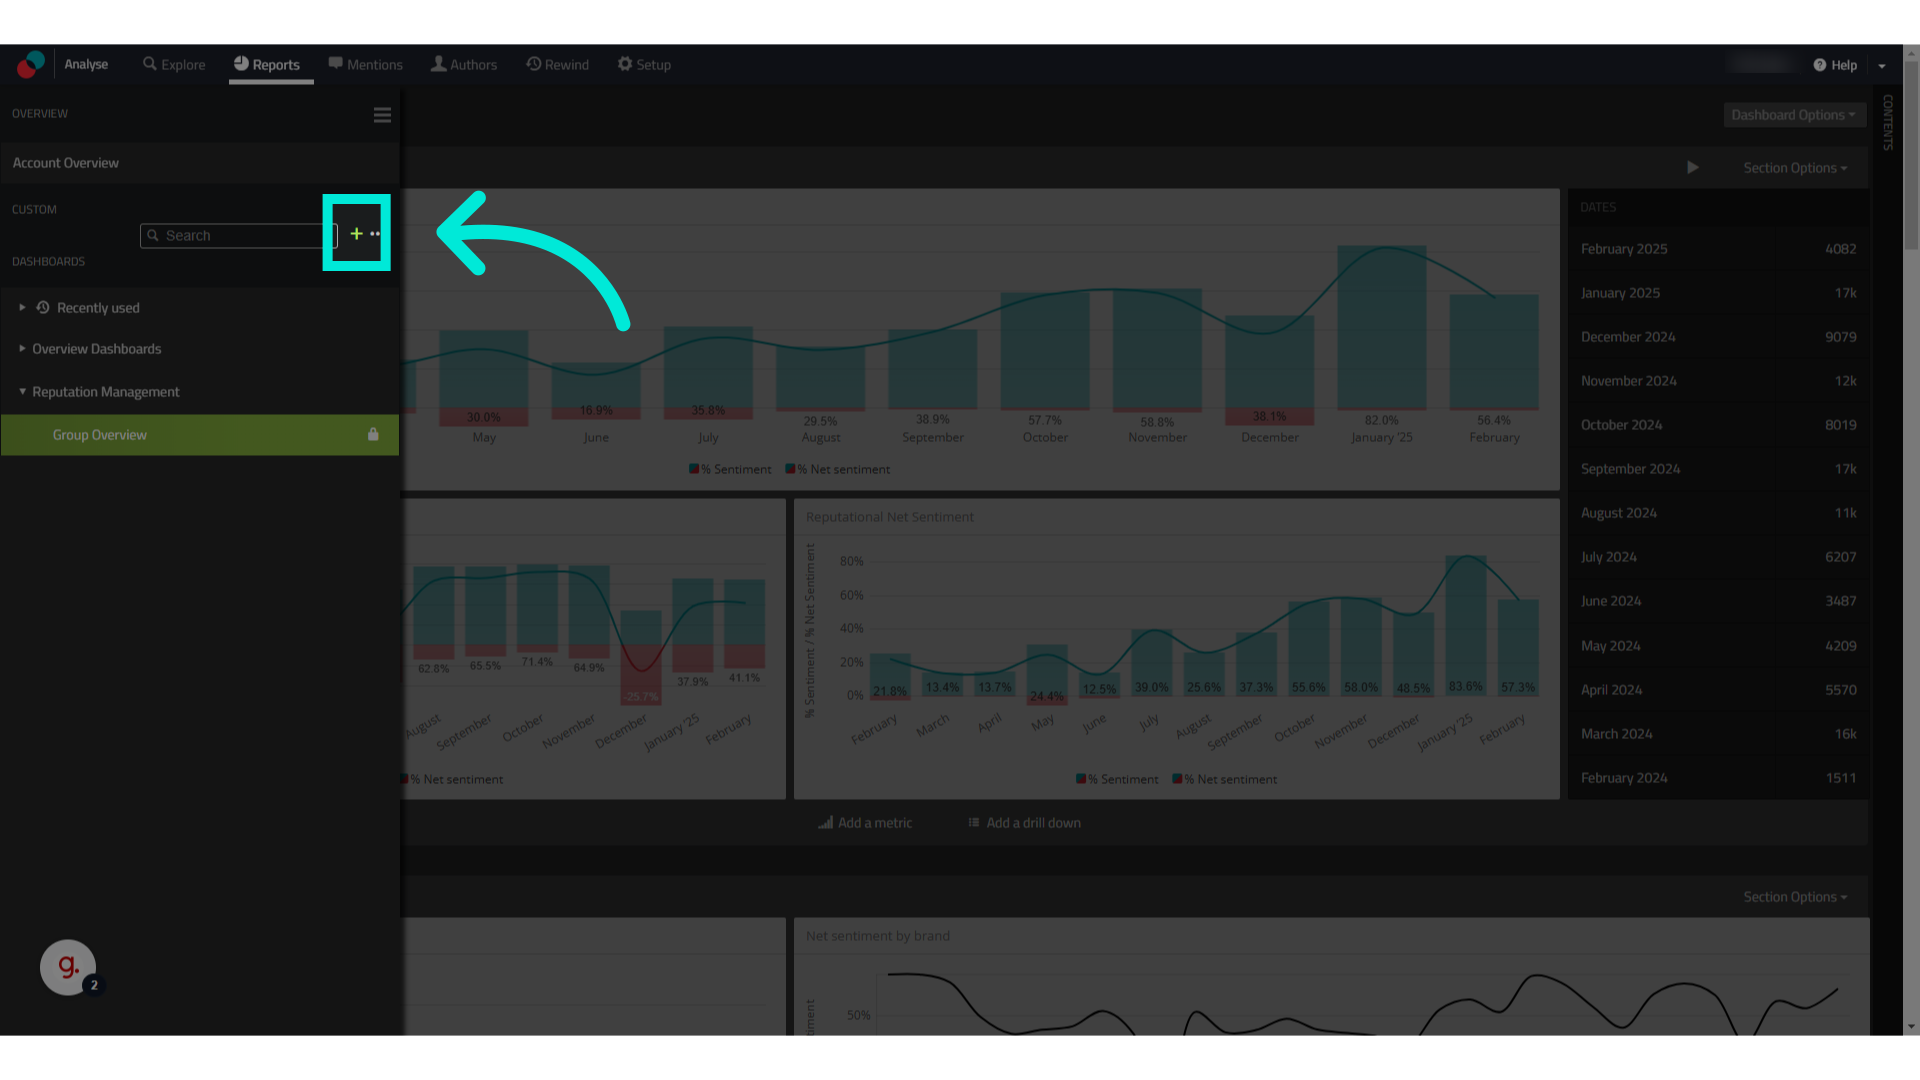
How to Add a New Dashboard
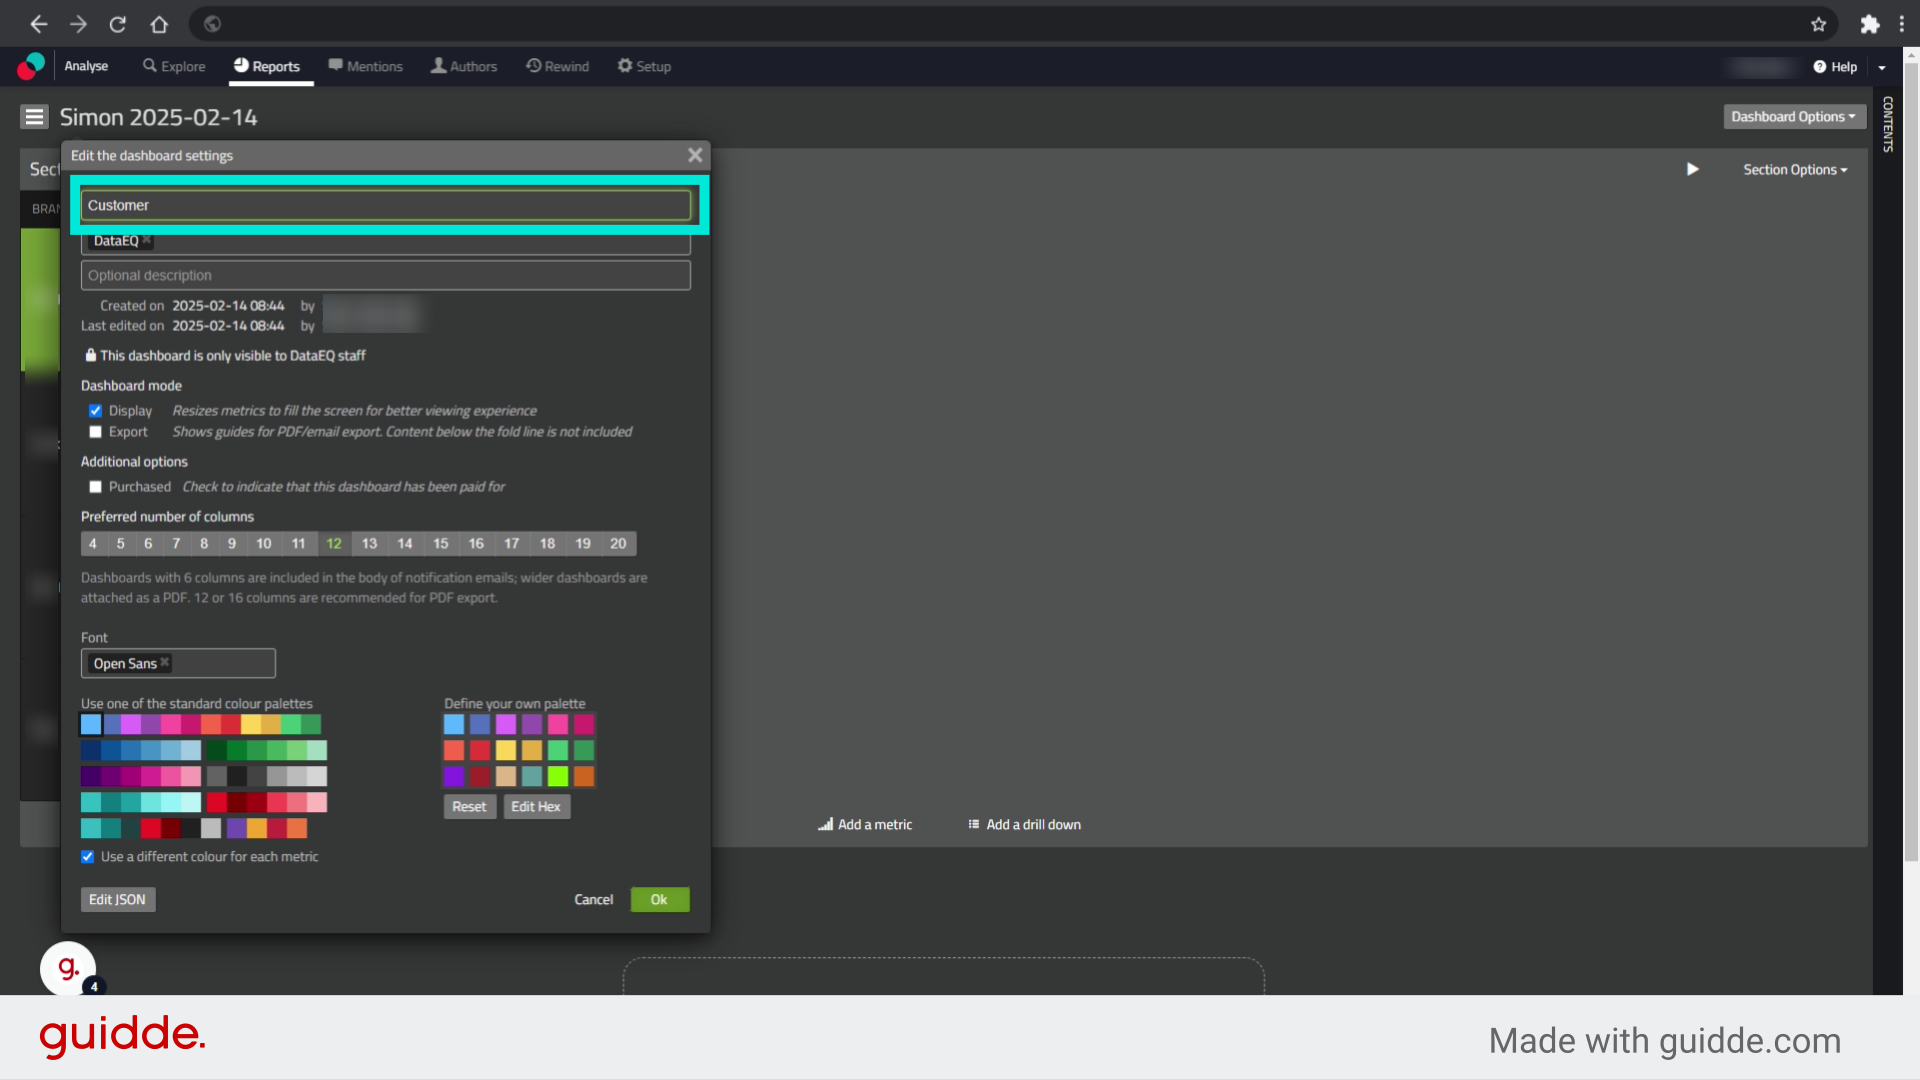
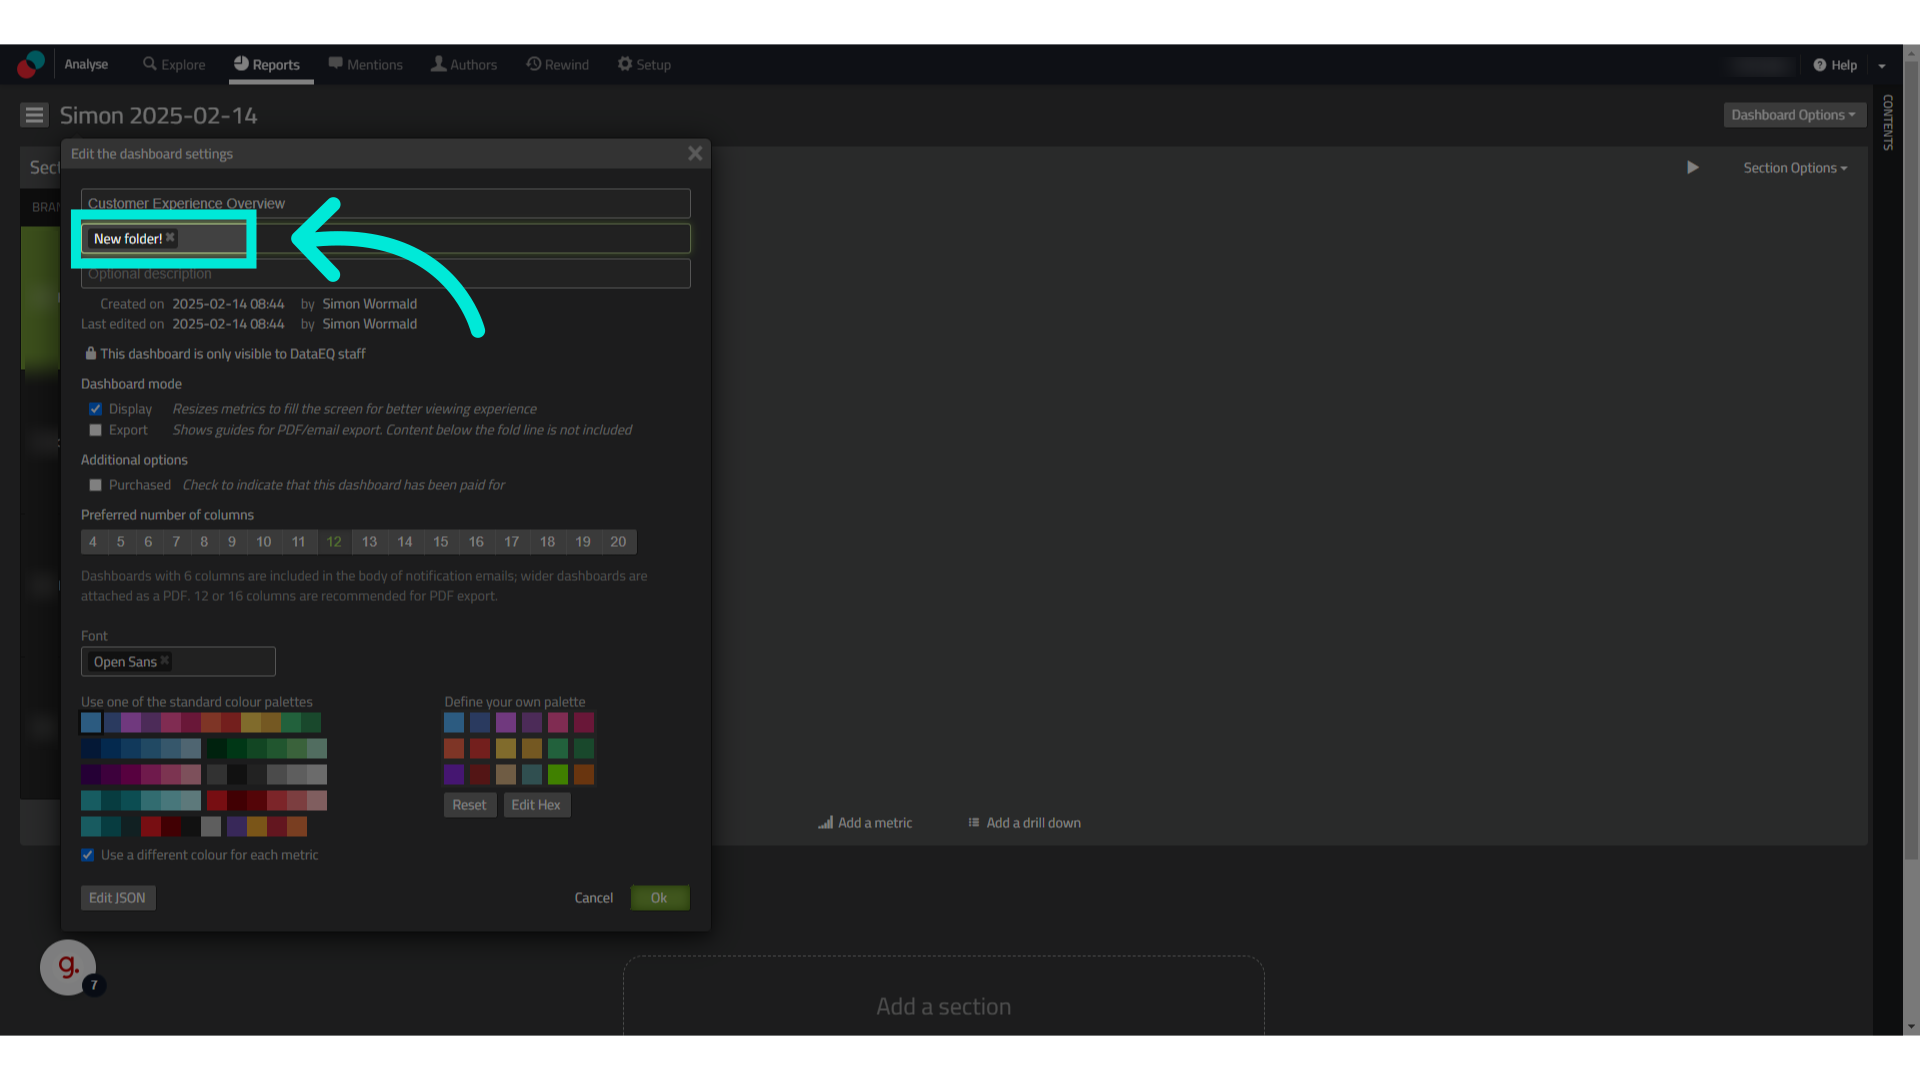
How to Customise Your Dashboard
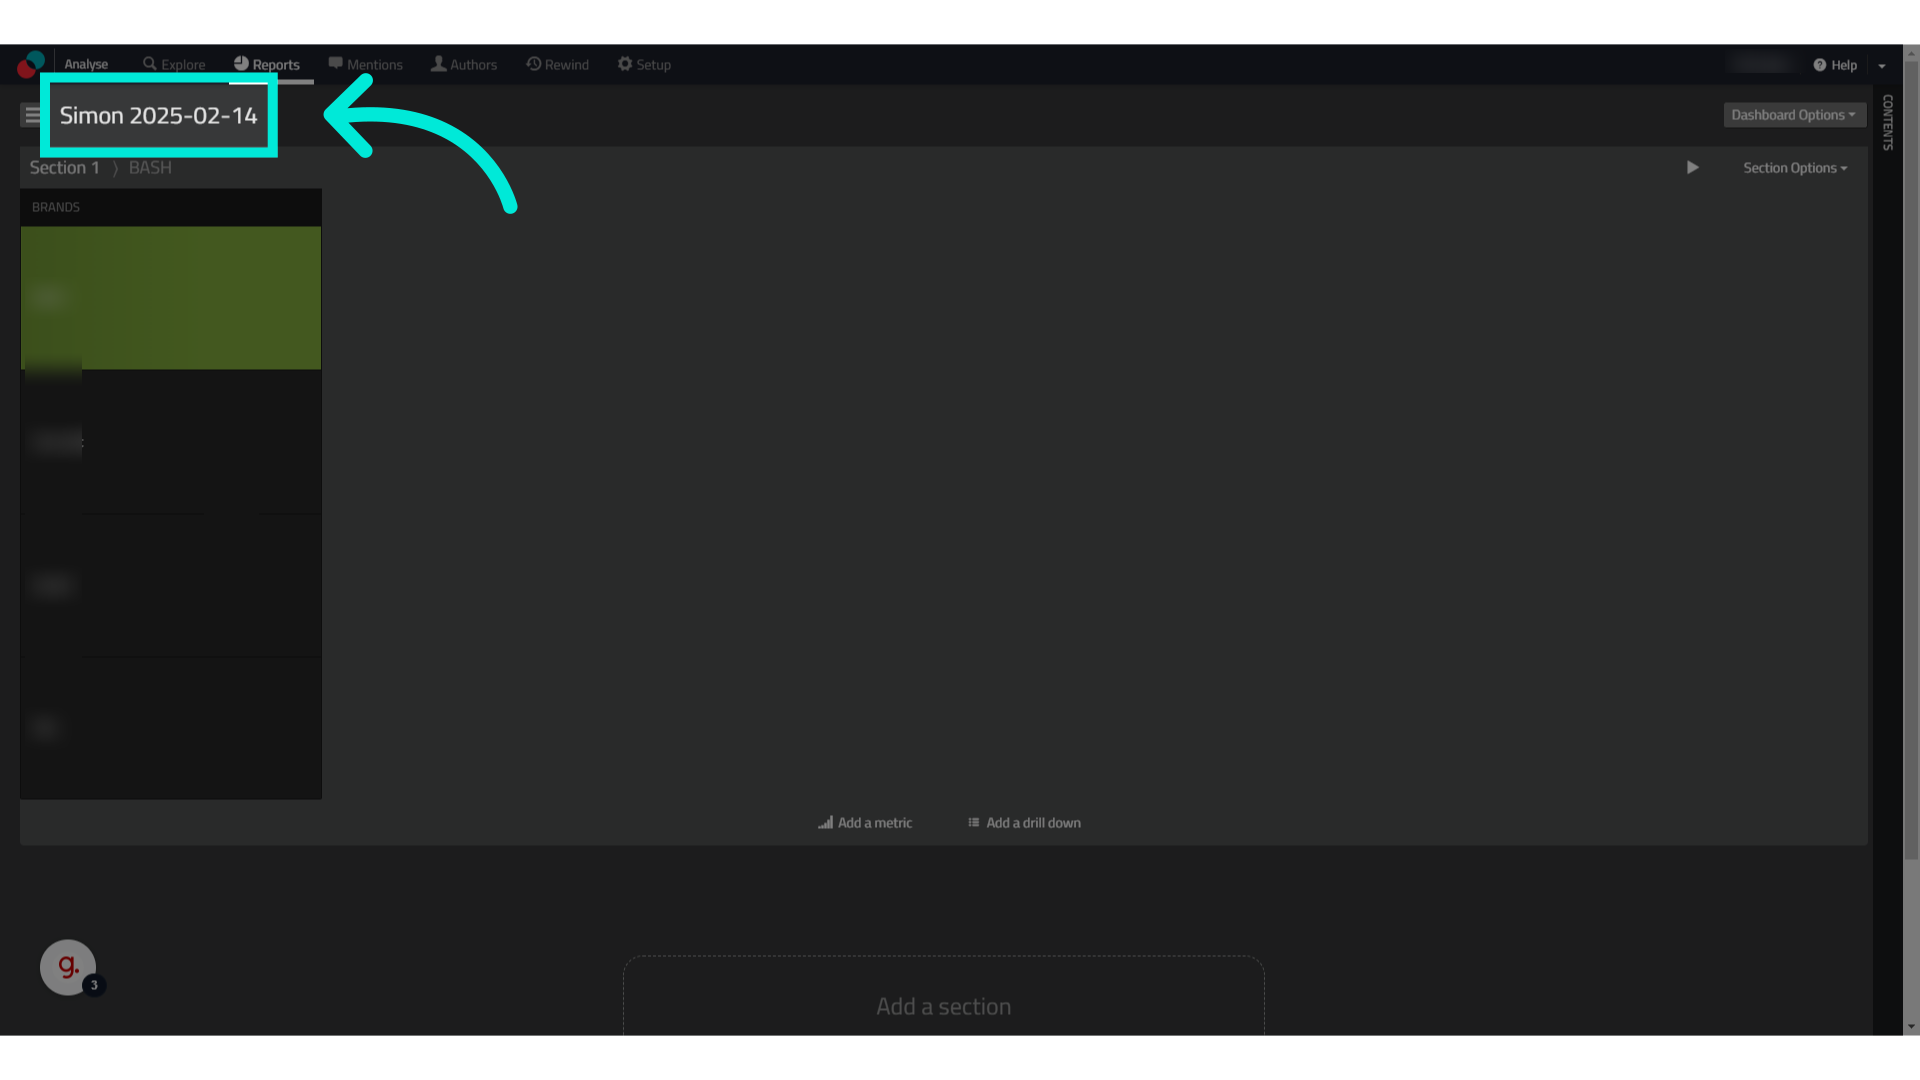
Adding a New Section
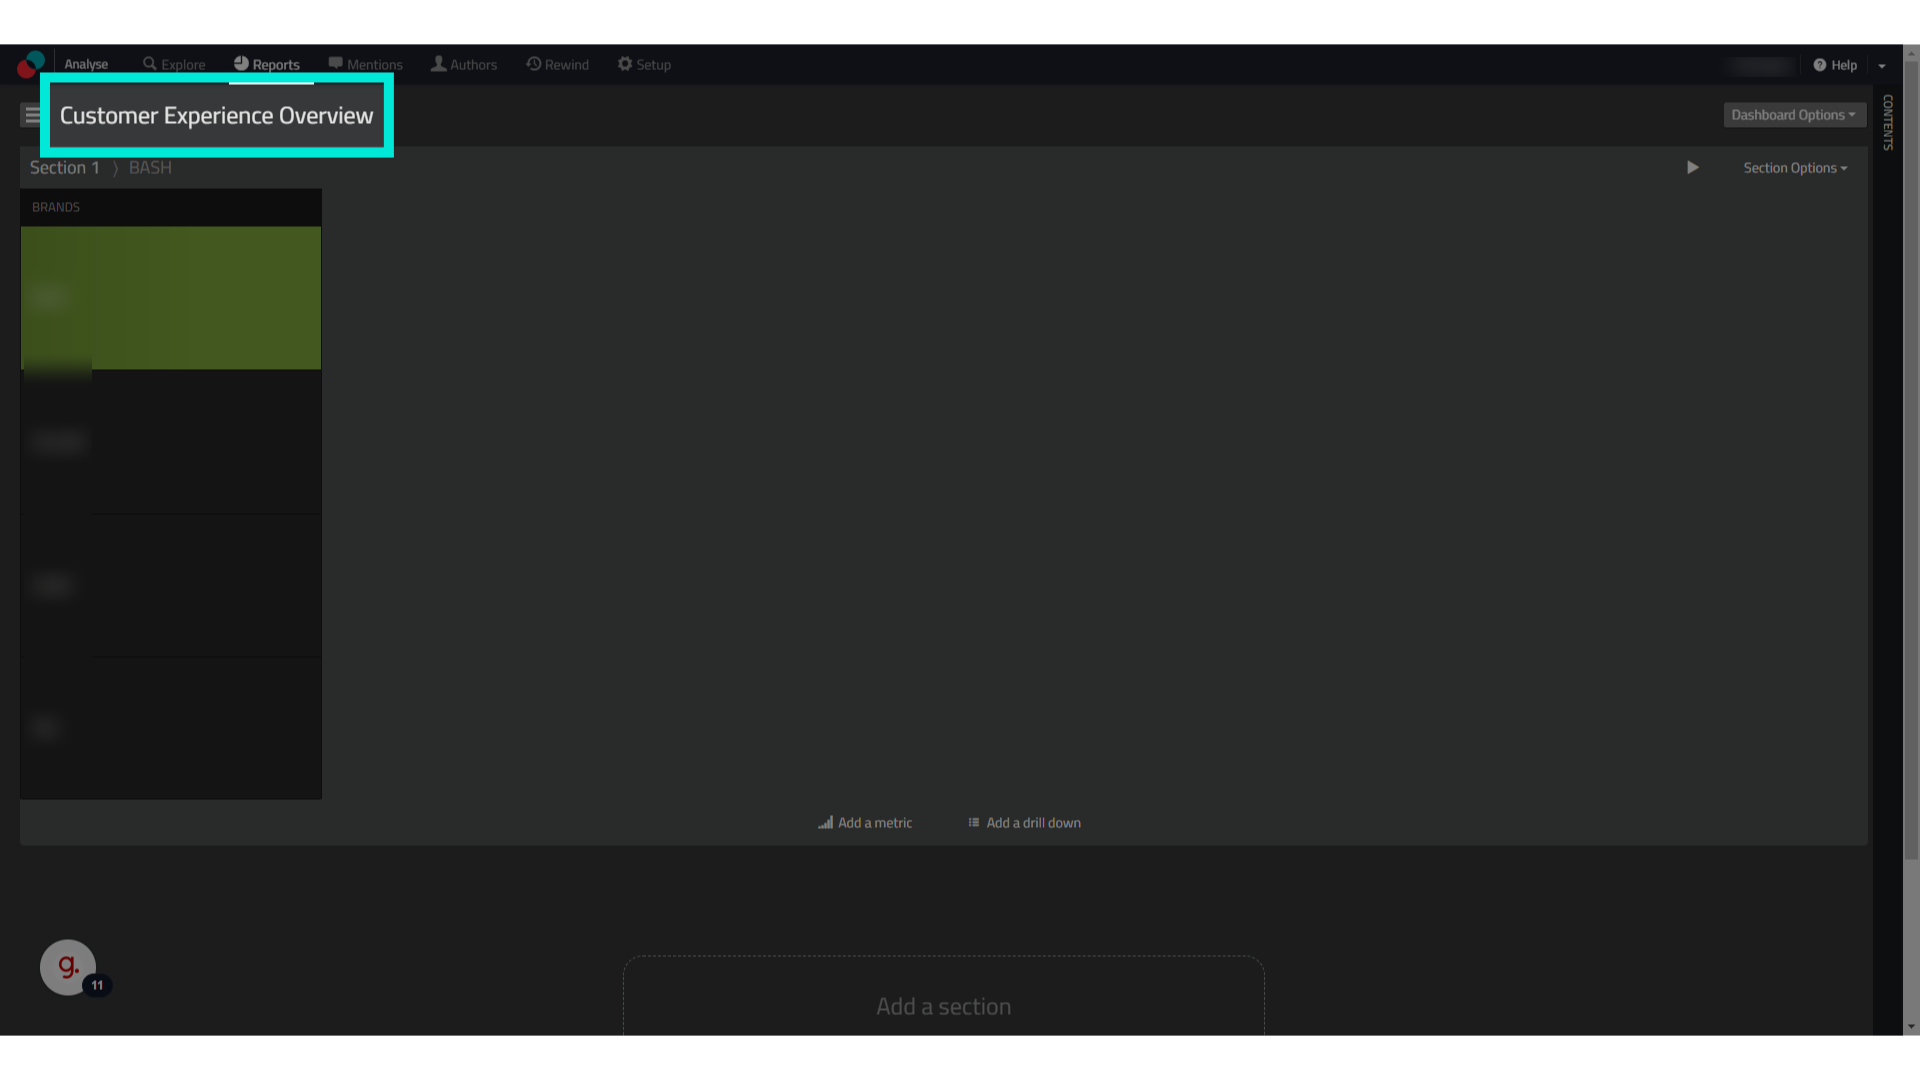
- Open your newly created dashboard.
- Click on Add Section at the bottom of the dashboard.
- Select filters (e.g., date range, brand, sentiment type).
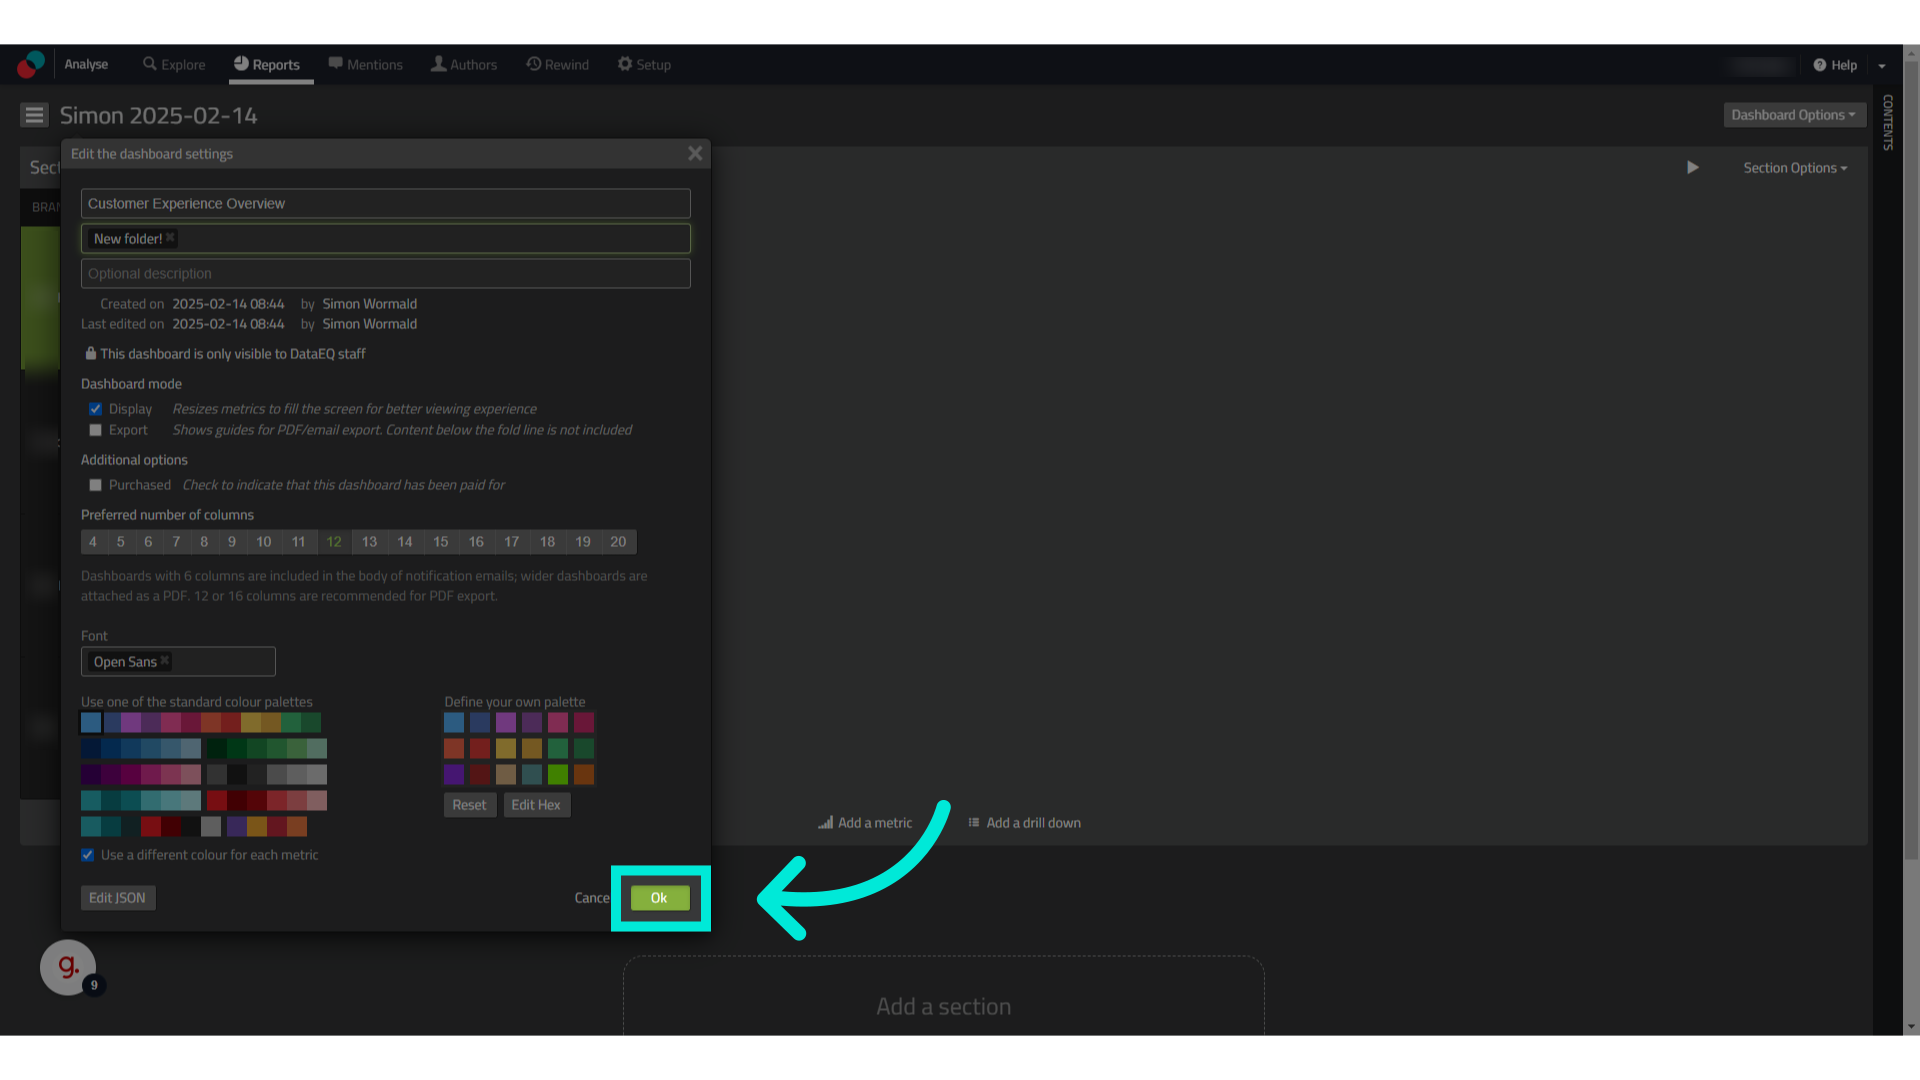
- Click Save to add the section.
Adding and Editing Metrics
- Inside a section, click Add Metric to display key data points.
- Choose a metric type (e.g., volume of mentions, sentiment trends, customer experience).
- Click on the metric’s title or the edit icon to modify it.
- Adjust data sources, filters, and visualisation types (e.g., bar charts, line graphs, topic wheels).
- Click Save to apply changes.
Duplicating Sections or Dashboards
- If you want to test different filters without losing the original setup, you can duplicate sections or entire dashboards.
- Click Section Options → Duplicate to copy a section within the same dashboard.
- Click Dashboard Options → Duplicate to create a full copy of the dashboard for modifications.
Best Practices for Custom Dashboards
- Use filters wisely to refine your data and make insights more actionable.
- Organise sections logically (e.g., group metrics by theme: sentiment, priority conversations, engagement).
- Keep dashboard names clear and descriptive for easy navigation.
- Duplicate dashboards before making major edits to preserve original settings.
Troubleshooting Dashboard Issues
- Issue: “My dashboard is empty”
- Ensure that data sources and filters are correctly applied.
- Try expanding the date range to include more data.
- Issue: “I can’t see the dashboard I created”
- Refresh the page and check if the dashboard appears under Reports.
- Make sure you have saved your dashboard changes before exiting.