Analyse allows you to export dashboards and metrics as images or CSV files for reporting and sharing purposes. You can also email reports directly to team members for real-time collaboration.
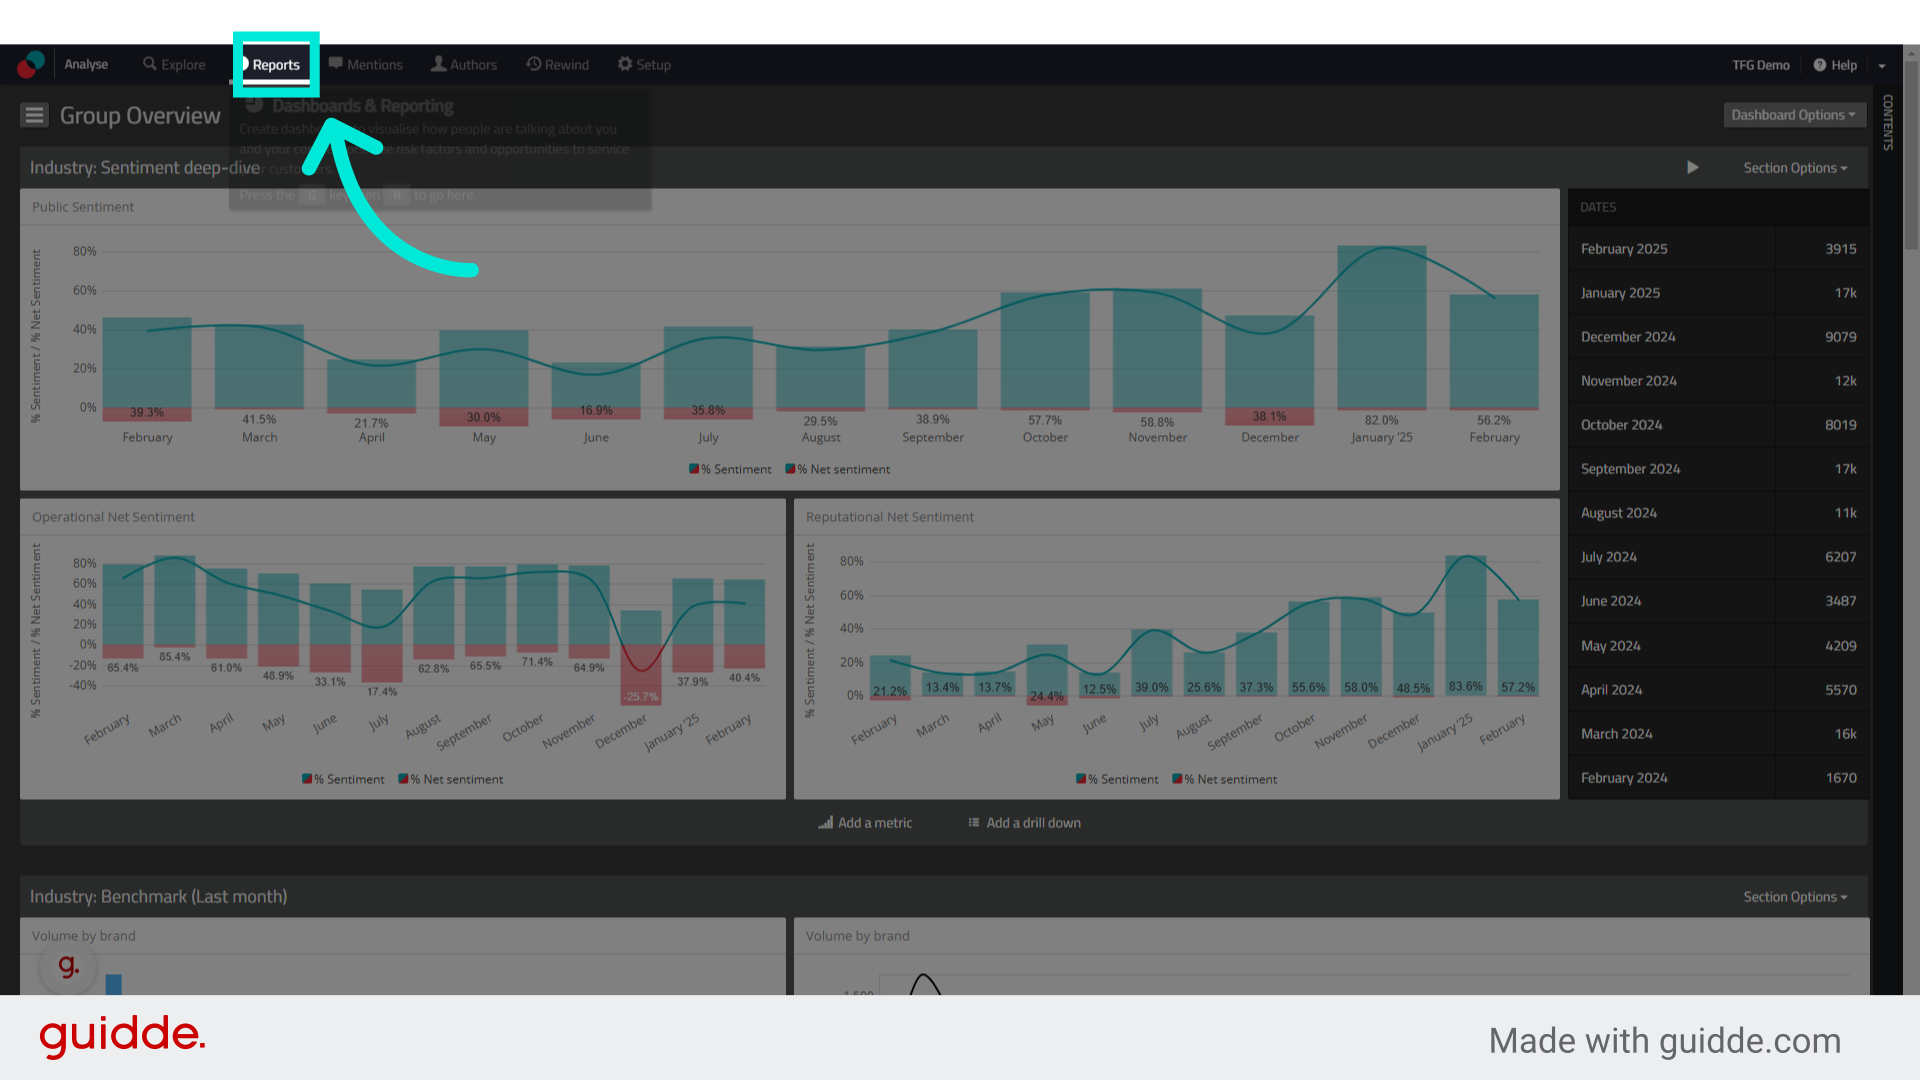
How to Download Reports from Analyse
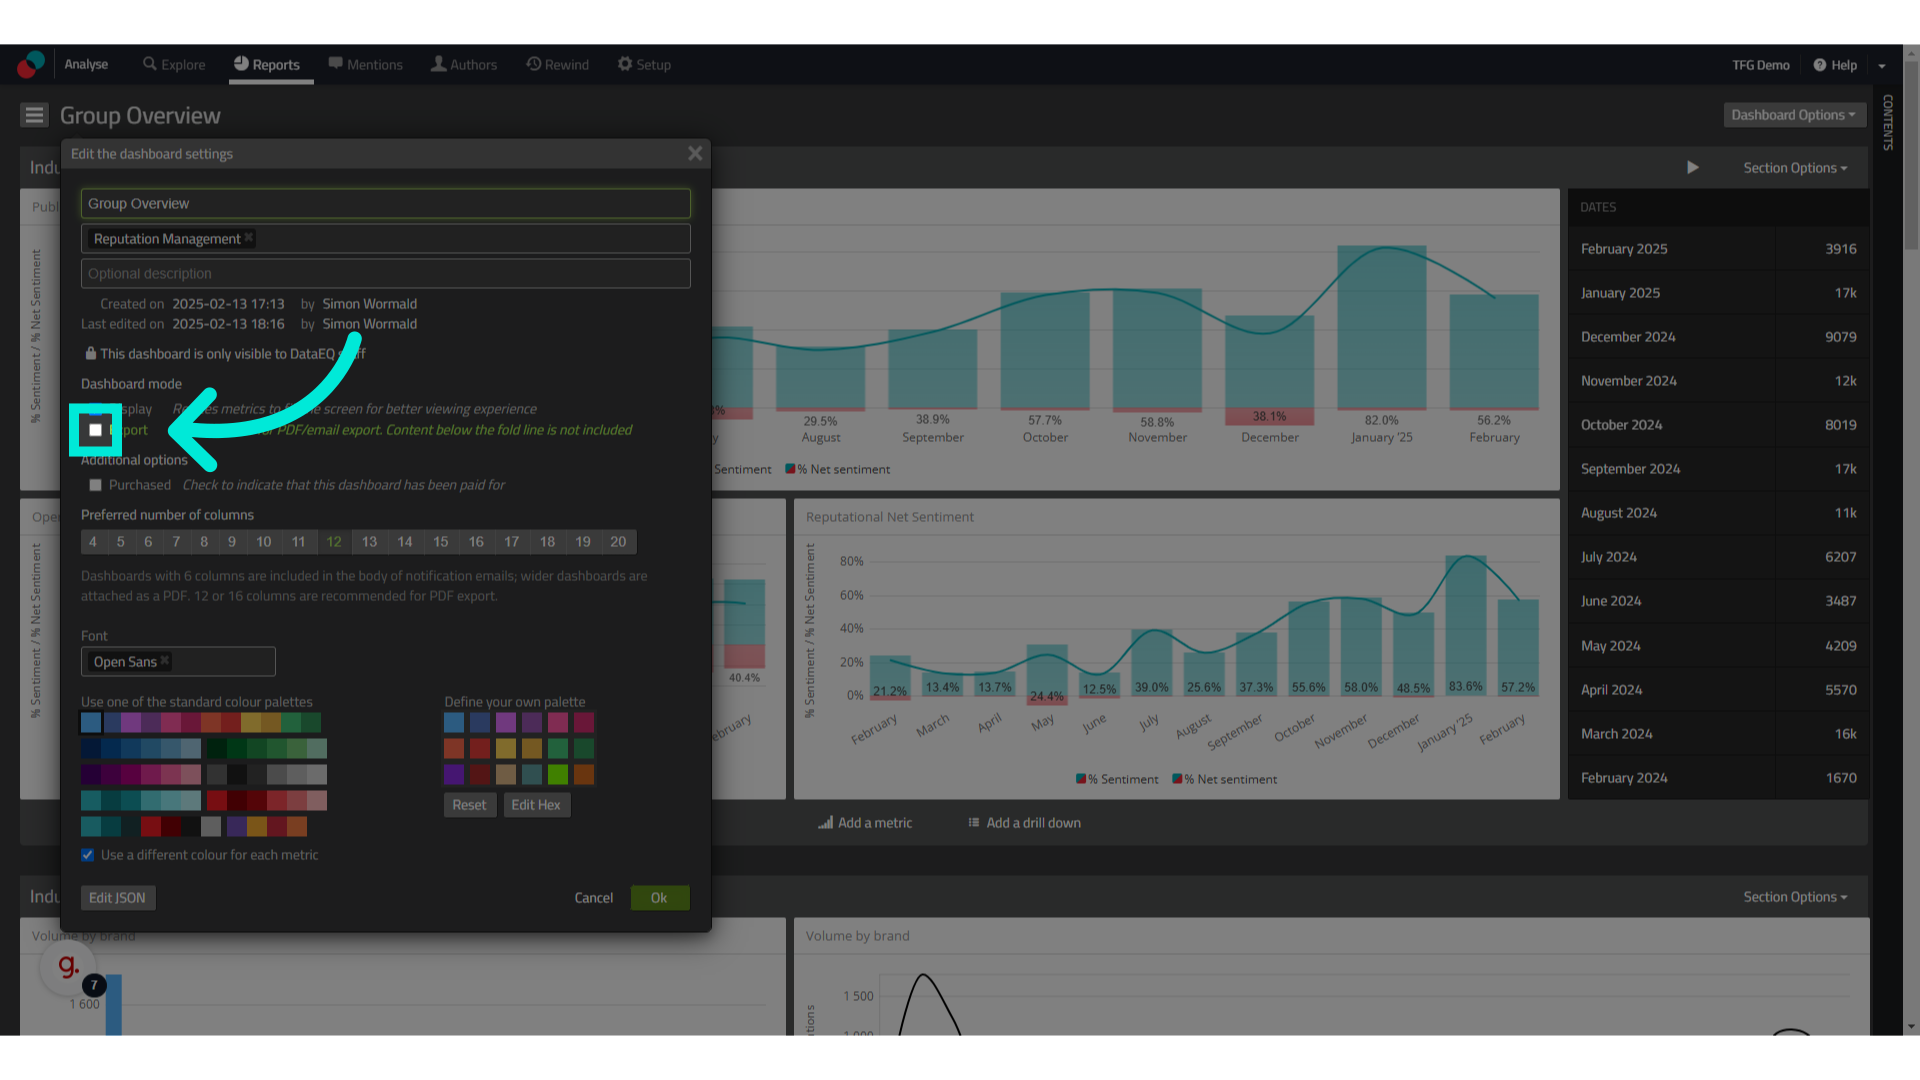
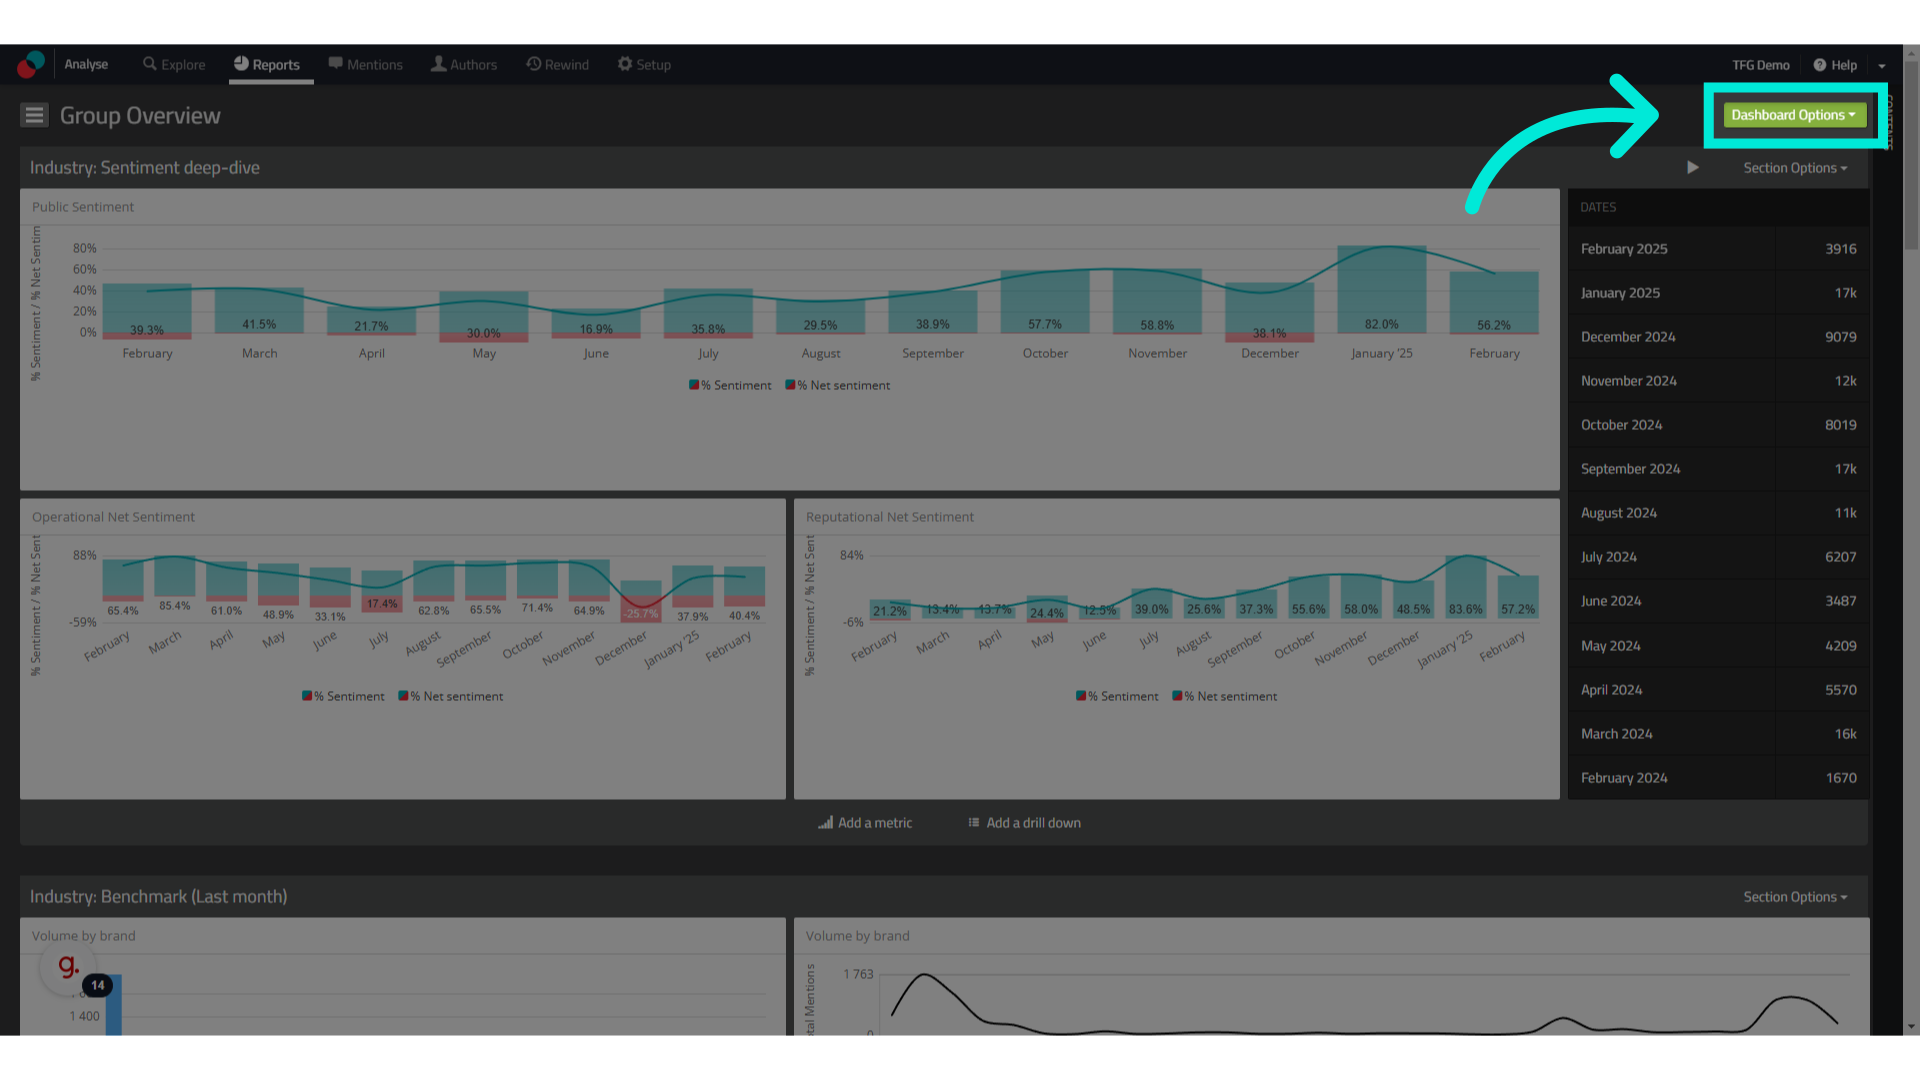
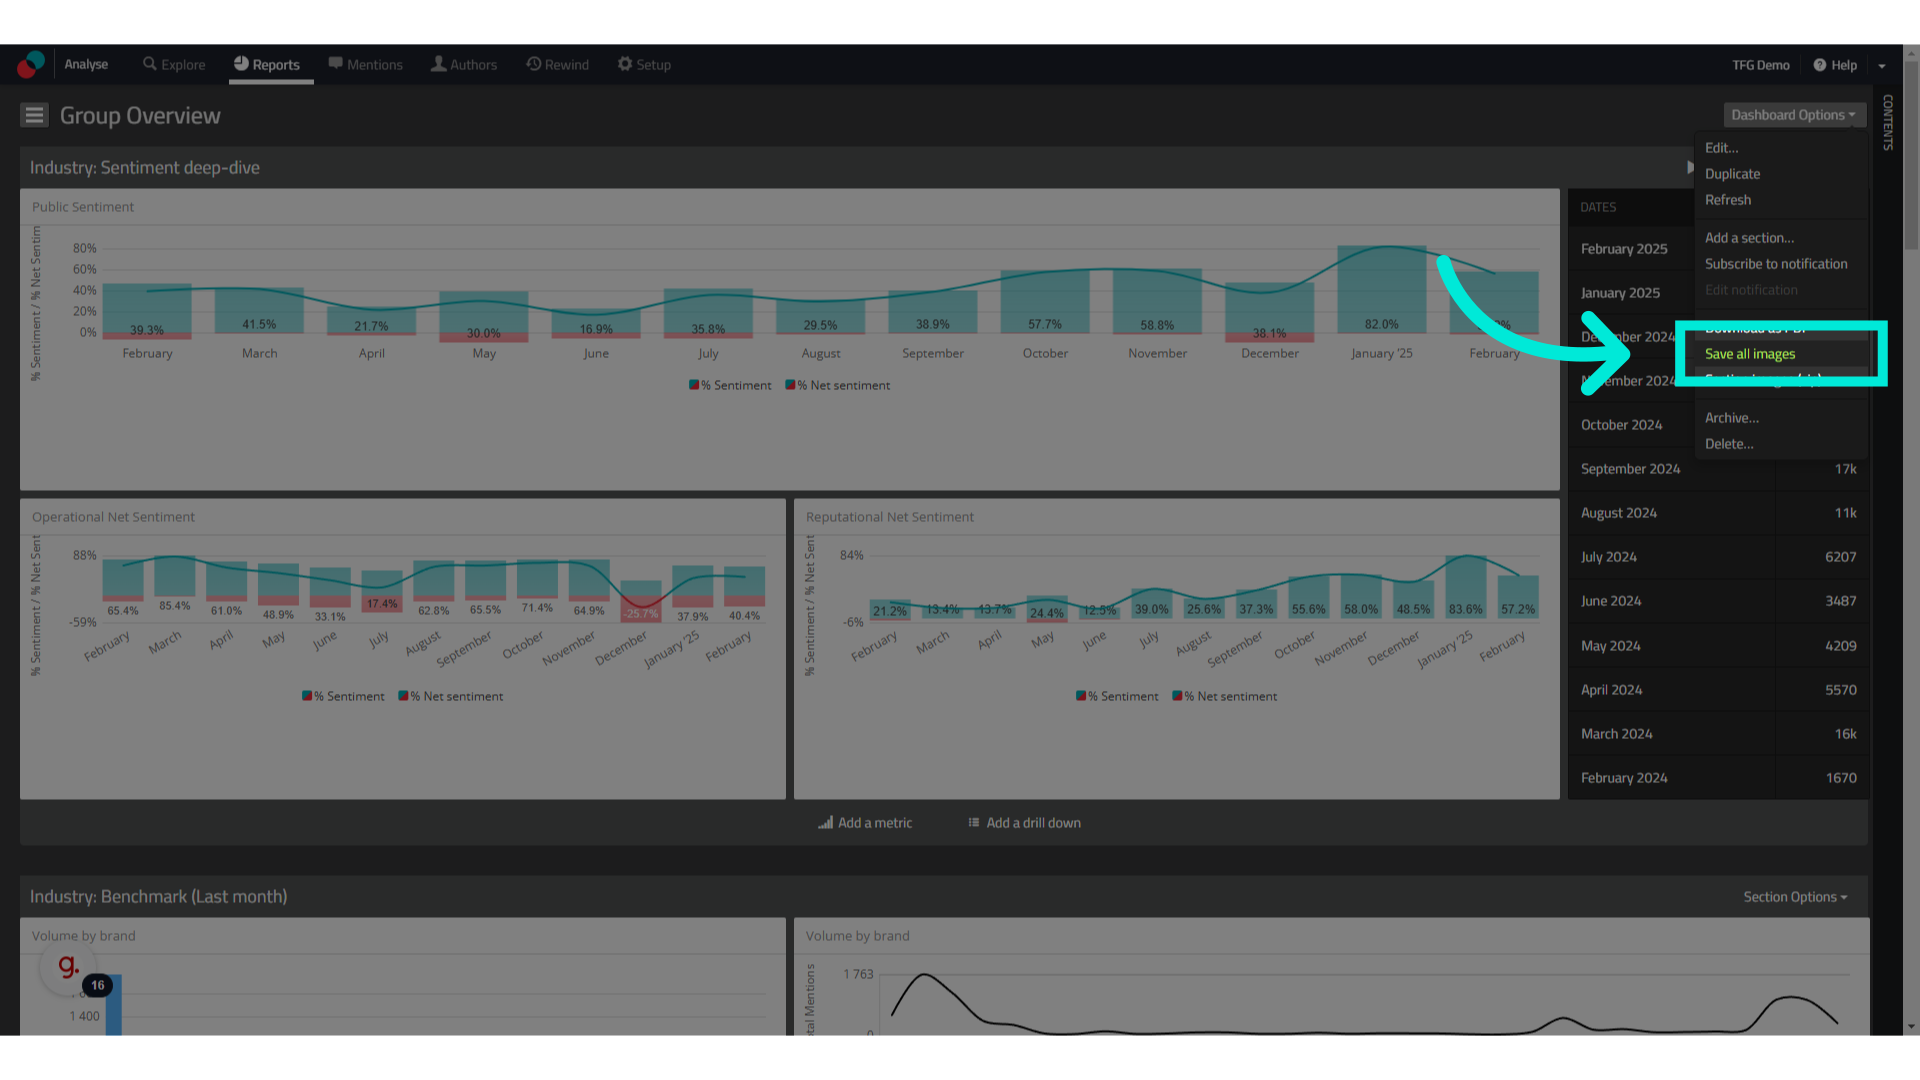
Downloading an Individual Metric or Section
- Open your dashboard and locate the metric you want to export.
- Click on the dropdown arrow (metric options) in the top-right corner of the metric. This arrow is sometimes invisible but hovering over the top right corner of a metric will reveal the arrow.
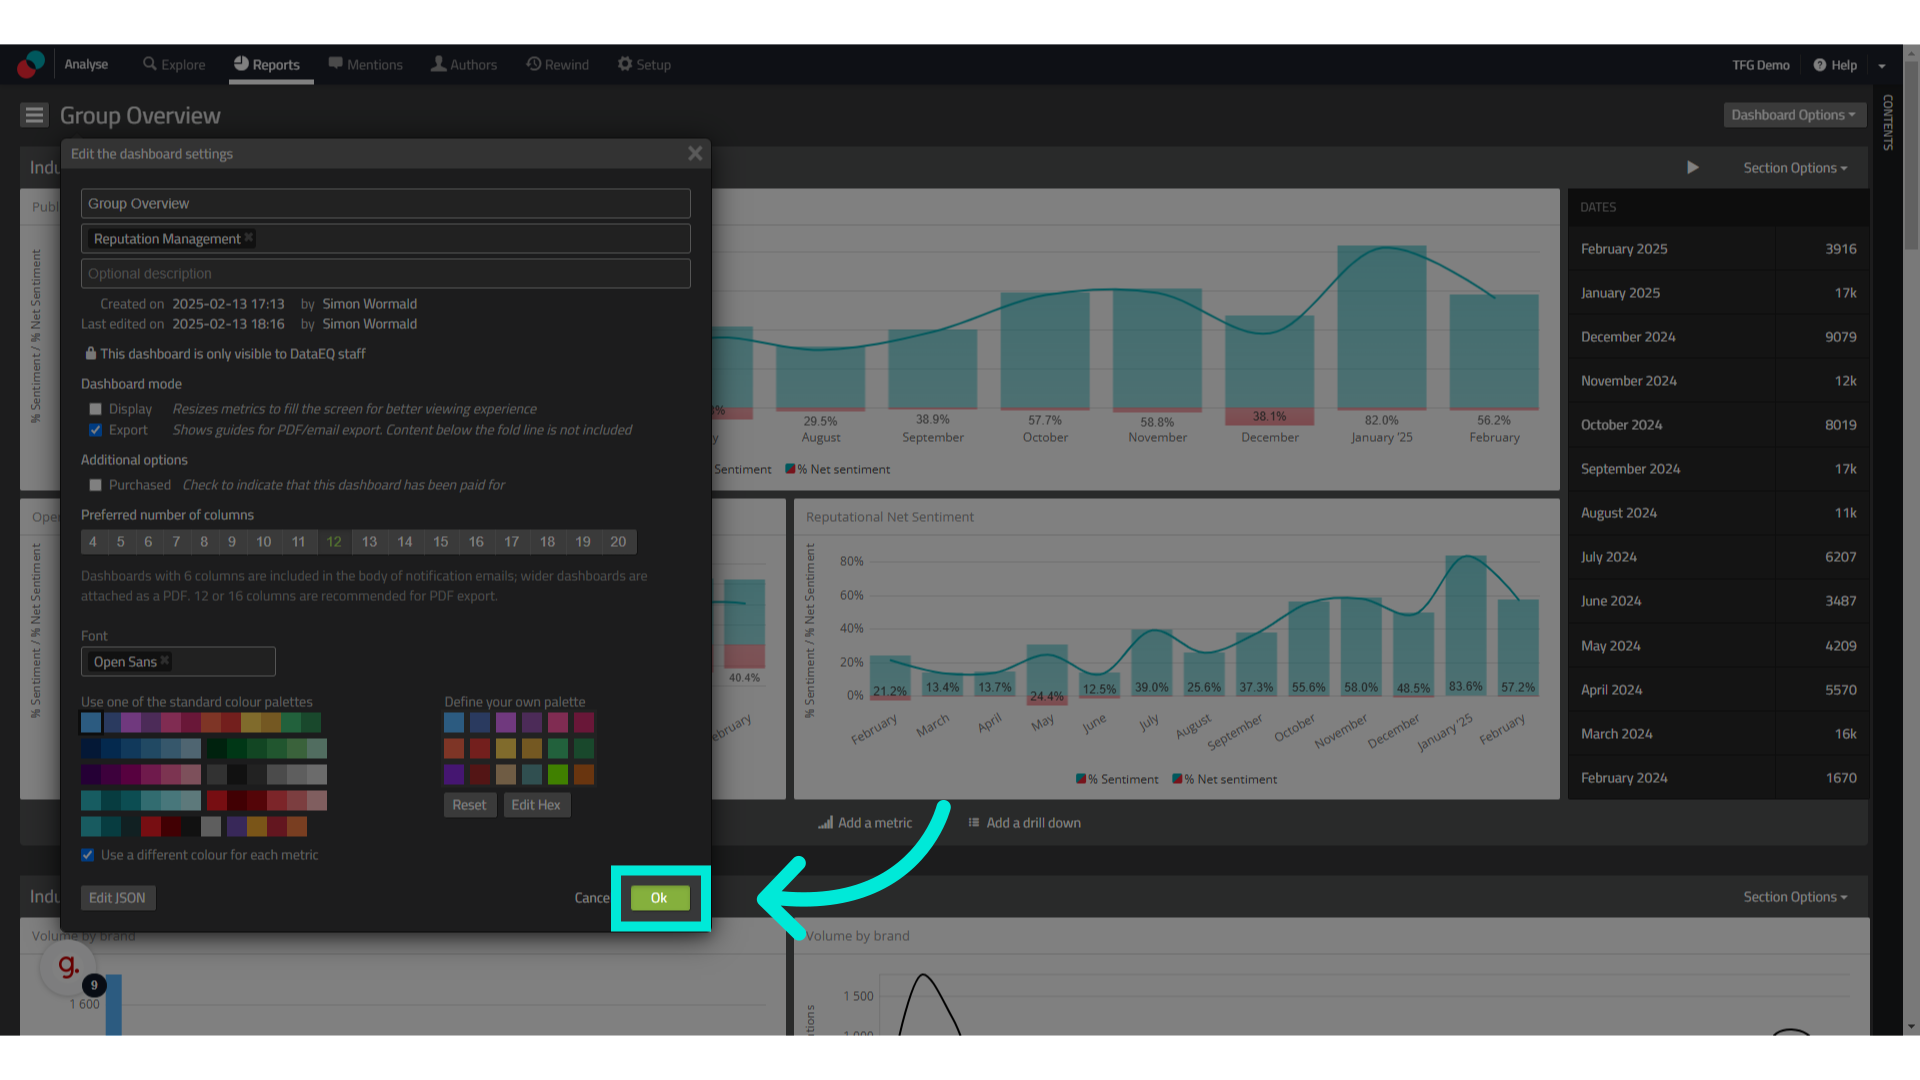
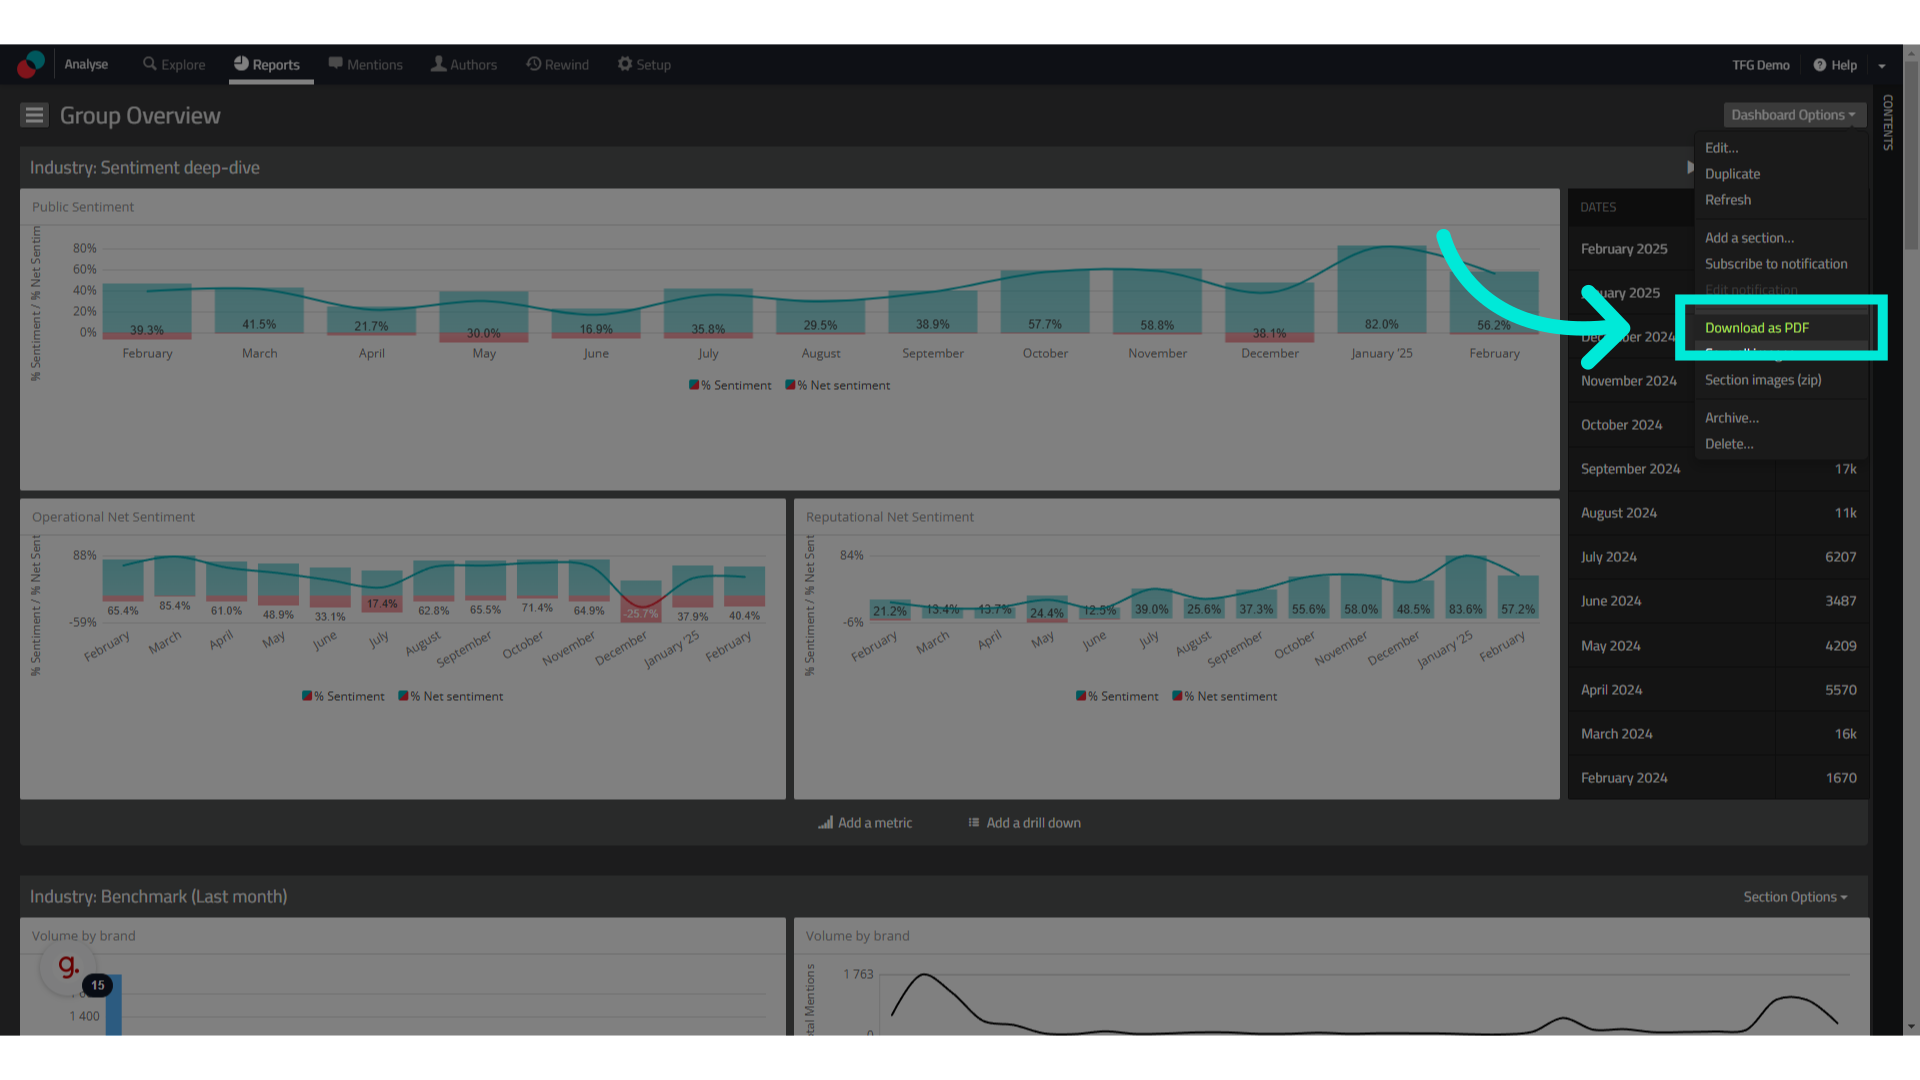
- Select Save all images or Export as CSV.
- Save the file to your computer.
How to Send Reports via Email
Setting Up Automated Email Reports
If you want to automatically send reports at specific intervals:
- Navigate to Setup on the navigation bar.
- Click on Emails and Notifications in the Settings section.
- Select Add a Notification.
- Choose the dashboard or data set to include.
- Set the frequency (daily, weekly, or monthly).
- Add recipient email addresses and click Save.
Best Practices for Sending & Downloading Reports
- Use CSV exports if you need to analyse raw data in Excel.
- Download images for presentations or quick visual reporting.
- Automate reports to keep stakeholders updated on key trends.
- Always check filters before exporting to ensure you’re capturing the right data.
Troubleshooting Export & Email Issues
- Issue: “I can’t download the dashboard”
- Ensure you have dashboard access permissions.
- Try refreshing the page and exporting again.
- Use a supported browser (Chrome, Firefox, Safari).
- Issue: “The recipient didn’t receive the email”
- Ask them to check their spam or junk folder.
- Verify that the email was entered correctly.
- Ensure that automated emails are enabled in settings.